Filters allow the user to generate analytics based on specific criteria. For example, a user may want to look at data based on a certain geographical location or they may want to check the status of a particular course title.
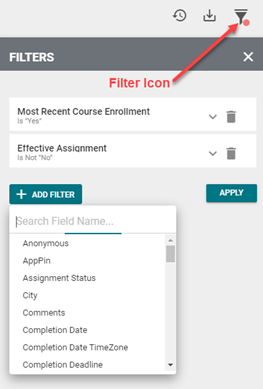
To manage filters, locate the Filter icon (funnel) in the dashboard toolbar.
Each dashboard has its own set of default filters. The example below shows the default filters for the Completion Deadline Status dashboard.
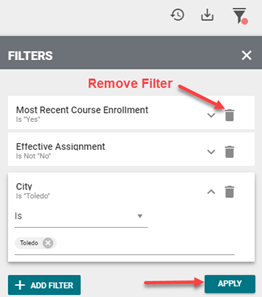
To add a new filter, click the Add Filter button and select a filter from the drop-down menu. Fill in the needed criteria for the filter and click the Apply button.
To remove a filter, click the Remove icon (trash can), then click the Apply button.
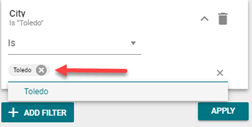
To remove a selection from the pick list, click the X icon next to the selection.
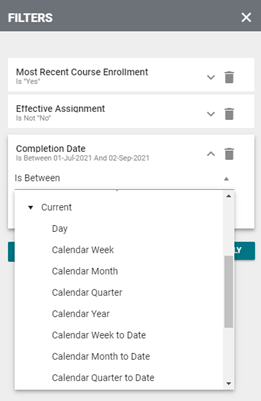
Filter pick lists can vary. Some pick lists, such as the completion Date filter pick list, require dates or date ranges. Click the drop-down box to view the different date range options.
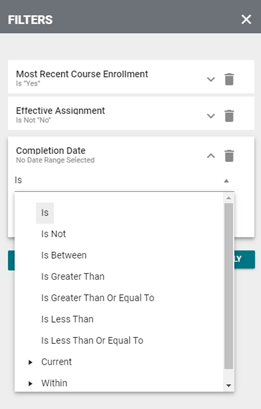
Choose an option under the Current category to select the current day, week, month, quarter, etc.
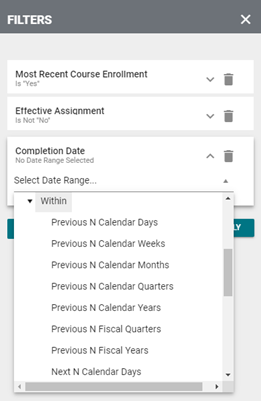
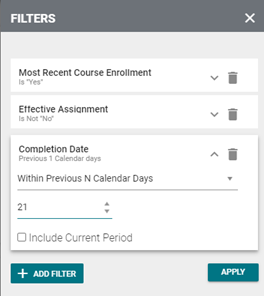
Choose an option under the Within category to filter the data by a user-specified number of time increments (days, weeks, months, etc.). In the example below, the user chose to filter Complete Date data that occurred within the last 21 calendar days.
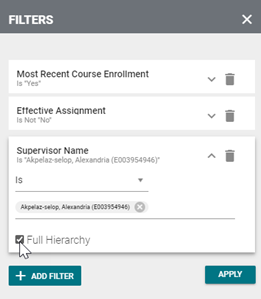
It can also be useful to filter by supervisor name. After selecting the Supervisor Name filter, click the drop-down area or begin typing a supervisor's name to make a selection. Click the Full Hierarchy checkbox to include data for every learner within the selected supervisor's hierarchy. If the Full Hierarchy box remains unchecked, data will only be provided for the supervisor's direct reports.
Completion Deadline Status Dashboard
On-Time vs. Late Completion % Dashboard